第 23 章 聚类
23 CLUSTERING
曲政 / 2018-05-22
相似聚簇的定义,举个生活例子?
把对象组织成组的过程,每个组里的对象某种程度上相似。
关键议题是定义 “相似”。
例如下图
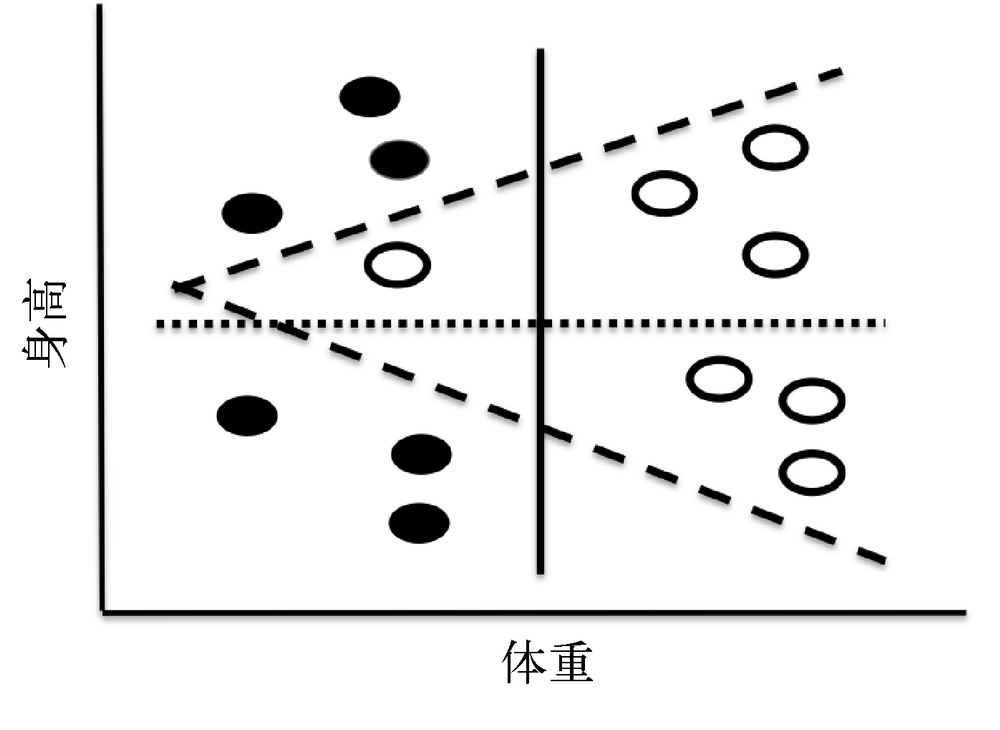
- 身高可以分成高矮,水平一条直点线。dotted
- 体重可以分成重轻,竖直一条直实线。solid
- 黑衬衫白衬衫,折线。dashed
相似聚簇是优化问题?如何定义?
目的 —— 一个簇的集合 a set of clusters
目标 —— 一个目标函数 an objective function - a given distance matric - minimize the dissimilarity of the examples within a cluster
约束 —— 一个约束的集合 a set of constraints
如何衡量一个簇中的实例多么不同?—— 差异度(变异度)
差异度 variability 类似 (方差 variance). provide a measure of the coherence of the cluster
- 用来描述集合的属性,不是一个元素。
- 每个元素与集合的平均值的距离。
- 距离的平方。
- 差别在于是否做标准化 —— 除以集合元素数量。
- 一个簇中实例数量多,变异度就大。不能直接用于两个大小不同的簇互相比较。
单个簇 c 中实例彼此之间的差异程度:
\[ {\rm variability}(c)=\sum_{e\in {c}}{\rm distance}({\rm mean}(c),e)^2 \]
这里的 mean (c) 是簇中所有实例的特征变量的均值。
如何衡量一个簇集合多么不同?
—— 相异度 dissimilarity,差异度之和。
define a dissimilarity metric for a set of clusters, C
- 大写的 C,是 clusters 集合。
- dissimilarity 衡量集合的集合的属性,不是一个集合。
- 单位也是距离的平方。
- 同样差异程度的两个集合,大集合对整体 dissimilarity 的贡献更大。要的就是这种效果 (This is by design.)
一个簇集合 C 的相异度:
\[ {\rm dissimilarity}(C)=\sum_{e\in {C}}{\rm variability}(c) \]
用 dissimilarity 做目标函数需要注意什么?
单纯最小化 dissimilarity,极端地把每个实例作为一个簇就可以。
所以加入限制:
两个簇之间的距离不能小于某个值。
或
簇的数量不能大于某个值。
23.1 Class Cluster
在实例类中定义什么?
# -*- coding: utf-8 -*-
class Example (object):

    def __init__(self, name, features, label = None):
        """
        :param name: 实例名字字符串
        :param features: 一个浮点数数组,或列表也可。
        :param label: 无监督学习,label 默认是 None
        """
        self.name = name
        self.features = pylab.array (features)
        self.label = label

    def dimensionality (self):
        """
        特征向量的维度
        :return: int
        """
        return len (self.features)

    def getFeatures (self):
        return self.features [:] # 注意这里是复制了一份数组

    def getLabel (self):
        return self.label

    def getName (self):
        return self.name

    def distance (self, other):
        # 注意这里的区别写法
        return minkowskiDist (self.features, other.getFeatures (), 2)

    def __str__(self):
        return self.name +':'+ str (self.features) + ':'\
               + str (self.label)
在 cluster 类中定义什么?
# -*- coding: utf-8 -*-
class Cluster (object):

    def __init__(self, examples):
        """假设 examples 是一个非空的 Example 类型列表"""
        self.examples = examples
        # 只有 examples 非空,才能算质心。
        self.centroid = self.computeCentroid ()

    def update (self, examples):
        """ 假设 examples 是一个非空的 Example 类型列表
           替换 examples;返回质心变化的程度 """
        # 把原来的质心转存起来。
        oldCentroid = self.centroid
        # 用新的实例更新了老实例列表。
        self.examples = examples
        # 计算出新质心。
        self.centroid = self.computeCentroid ()
        # 计算新老质心距离。
        return oldCentroid.distance (self.centroid)

    def computeCentroid (self):
        """
        Centroid 是簇中所有实例的特征向量的欧氏均值 Euclidean mean,类似于质量重心 center of mass。
        :return: example 类型,一个虚拟实例,它很可能不在原始实例集中。
        """
        # 建一个特征向量那么长的数组
        vals = pylab.array ([0.0]*self.examples [0].dimensionality ())
        # 累加入数组
        for e in self.examples:
            vals += e.getFeatures () #敢这么写,因为 features 在实例初始化时已经转变成了数组。
        # 建一个 Example 实例,用特征均值初始化
        centroid = Example ('centroid', vals/len (self.examples))
        return centroid

    def getCentroid (self):
        return self.centroid

    def variability (self):
        totDist = 0.0
        for e in self.examples:
            totDist += (e.distance (self.centroid))**2
        return totDist

    def members (self):
        #做成了 genertator
        for e in self.examples:
            yield e

    def __str__(self):
        names = []
        for e in self.examples:
            names.append (e.getName ())
        #默认打印 names 时有顺序
        names.sort ()
        #注意这个格式,centroid 没有重复计算,也没有用封装写法。
        result = 'Cluster with centroid '\
               + str (self.centroid.getFeatures ()) + ' contains:\n '
        for e in names:
            # result = result + e + ', '
            result += e + ', '
        return result [:-2] # 不输出结尾的 ","。
23.2 K-means Clustering
相似聚簇有哪几种方法?
三种:
- k-means clustering,k 均值聚类,最常用,并非所有场合最合适
- hierarchical clustering,层次聚类
- EM-clustering,EM 聚类
K 均值聚簇问题如何描述?
它的目标是将一个实例集合划分为 k 个簇,使得:
- 对于簇中的每个实例,在各个簇的质心之中,这个簇的质心是离这个实例最近的;Each example is in the cluster whose centroid is the closest centroid to that example, and
- 由这 k 个簇组成的簇集合的相异度最小。The dissimilarity of the set of clusters is minimized.
不幸的是,在一个大数据集合上找出这个问题的最优解在计算上是不可行的 computational intractable。
K 均值聚类的有效贪婪算法怎么写?计算复杂度是多少?
幸运的是,有一种非常有效的贪婪算法可以找到非常好的近似解。这种算法由伪代码描述如下。
随机选择 k 个实例作为初始的簇质心
一直重复以下步骤:
将每个实例都分配给距离最近的质心,建立 k 个簇;
对每个簇中的所有实例取均值,计算出 k 个新质心;
如果所有质心都与上一次迭代时相同,则返回当前的簇集合。
第一个步骤的复杂度是 O (knd),其中 k 是簇的数量,n 是实例的数量,d 是计算两个实例之间的距离所需的时间。 第二个步骤的复杂度是 O (n),第三个步骤的复杂度是 O (k)。所以,一次迭代的复杂度是 O (knd)。
# -*- coding: utf-8 -*-
def kmeans (examples, k, verbose = False):
    """ 随机选择 k 个质心,迭代出 k-means 法局部最优解。
    :param examples: 原始实例集。
    :param k: 几个簇。
    :param verbose: boolean,是否打印 k-means 函数迭代的中间结果。
    :return: clusters,迭代收敛完毕的 k 个簇的列表
    """

    #随机选取 k 个初始质心,为每个质心创建一个簇
    # 从实例列表中随机选取 k 个实例,作为质心。
    initialCentroids = random.sample (examples, k)
    clusters = [] # clusters 是一个初始随机选择的质心组成的簇的列表
    for e in initialCentroids:
        clusters.append (Cluster ([e])) #为每个质心创建一个簇,添加到簇列表中。

    #迭代,直至质心不再改变
    converged = False
    numIterations = 0
    while not converged:
        numIterations += 1
        #创建一个簇的列表,包含 k 个不同的空列表(簇)。
        newClusters = []
        for i in range (k):
            newClusters.append ([])

        #将每个实例分配给最近的质心
        for e in examples:
            #从每个实例出发,逐个遍历它与每个簇的质心之间的距离。
            # 初始化最小距离,用第 [0] 个簇的质心,"最近簇" 的 index 也初始化为 0。
            smallestDistance = e.distance (clusters [0].getCentroid ())
            index = 0
            for i in range (1, k): # 从第 [i] 个质心算起
                distance = e.distance (clusters [i].getCentroid ()) #计算新距离
                if distance < smallestDistance: #如果新距离比最小距离还小
                    smallestDistance = distance #替换最小距离
                    index = i #替换 "最近簇" 的 index
            #将 e 添加到相应簇的实例列表
            newClusters [index].append (e) # 可能发生某个 index 的簇中没有任何实例

        #这里的策略是不接受空簇,报告异常。
        for c in newClusters:
            if len (c) == 0:
                raise ValueError ('Empty Cluster')

        #更新每个簇;检查质心是否变化
        converged = True # 先打标:收敛完毕
        for i in range (k):
            # 用 newClusters 逐个更新 clusters,同时检验质心变化距离
            if clusters [i].update (newClusters [i]) > 0.0:
                converged = False # 只要有一个簇的新老质心还有距离,就没有全部收敛

        # 在每个 while 循环中间,打印输出阶段性成果
        if verbose:
            print ('Iteration #' + str (numIterations))
            for c in clusters:
                print (c)
            print ('') # 空行分割
    return clusters
K 均值相似聚类的贪婪算法的缺点是什么?如何克服?
K 均值算法的一个问题是,最后的返回值严重依赖于初始随机选择的质心集合。如果选择了一组非常糟糕的初始质心,那么算法得到的局部最优解会严重偏离全局最优解。在实际使用中,解决这个问题的一般方法是,多次选择初始质心集合以多次运行 K - 均值算法,然后选择使簇集合相异度最小的那个解。
图 23-4 中的函数 trykmeans 多次调用函数 kmeans,并选择相异度最小的结果。如果 kmeans 函数生成一个空的簇集合从而引起异常,trykmeans 就重新进行调用,假定最终 kmeans 会选择一个能成功收敛的初始质心集合。
# -*- coding: utf-8 -*-
def trykmeans (examples, numClusters, numTrials, verbose = False):
    """ 调用 kmeans 函数 numTrials 次,返回相异度最小的结果.
    :param examples: 原始实例集。
    :param numClusters: 几个簇。
    :param numTrials: 把 k-means 法尝试多少次。
    :param verbose: boolean,是否打印 k-means 函数运行的结果。
    :return: best,list,几次实验中,差异度最小的那种情况,是 kmeans 函数返回的簇的列表。
    """

    # 初始化 best 列表和最小差异度。
    best = kmeans (examples, numClusters, verbose)
    minDissimilarity = dissimilarity (best)
    trial = 1

    while trial < numTrials:
        # 如果失败,存在空簇,则重做。
        try:
            clusters = kmeans (examples, numClusters, verbose)
        except ValueError:
            continue

        # 比较并保留差异度最小的那种情况
        currDissimilarity = dissimilarity (clusters)
        if currDissimilarity < minDissimilarity:
            best = clusters
            minDissimilarity = currDissimilarity
        trial += 1
    return best
23.3 A Contrived Example
如何认为生成几个实例集,试验分类效果?
# -*- coding: utf-8 -*-
def genDistribution (xMean, xSD, yMean, ySD, n, namePrefix):
    """ 生成由 n 个实例组成的列表,每个实例的特征向量是二维的实数,符合 Gauss 分布。
    :param xMean: float,x 期望值
    :param xSD: float,x 标准差
    :param yMean: float,y 期望值
    :param ySD: float,y 标准差
    :param n: 实例的数量
    :param namePrefix: str,实例名的前缀,提示批次
    :return: 实例的列表
    """
    samples = []
    for s in range (n):
        x = random.gauss (xMean, xSD)
        y = random.gauss (yMean, ySD)
        samples.append (Example (namePrefix+str (s), pylab.array ([x, y])))
    return samples


def contrivedTest2 (numTrials, k, verbose = False):
    """
    把有重合的三个正态分布的点集,分别绘制到同一张图上;检验 k-means 方法的效果。
    :param numTrials: k-means 方法尝试多少次。
    :param k: 分出几个簇。
    :param verbose: 是否打印 k-means 方法每次迭代的中间结果。
    :return: None,一张图表标注点的位置,打印最终相似聚簇的结果。
    """
    xMean = 3
    xSD = 1
    yMean = 5
    ySD = 1
    n = 8 #每组生成的点数。
    # A 集的 xy 期望中心是 (3, 5), xy 标准差都是 1。
    d1Samples = genDistribution (xMean, xSD, yMean, ySD, n, 'A')
    plotSamples (d1Samples, 'k^')
    # B 集的 xy 期望中心是 (6, 5), xy 标准差都是 1。
    d2Samples = genDistribution (xMean+3,xSD,yMean, ySD, n, 'B')
    plotSamples (d2Samples, 'ko')
    # C 集的 xy 期望中心是 (3, 8), xy 标准差都是 1。
    d3Samples = genDistribution (xMean, xSD, yMean+3, ySD, n, 'C')
    plotSamples (d3Samples, 'kx')
    # 获得 k-means 结果
    clusters = trykmeans (d1Samples + d2Samples + d3Samples,
                         k, numTrials, verbose)
    # pylab.ylim (0,15)
    print ('Final result has dissimilarity',
          round (dissimilarity (clusters), 3))
    for c in clusters:
        # print ('', c) #为什么要加一个空字符串?为了空行吗?
        print (c)
如何在二维图上给每个点标注名称?
# -*- coding: utf-8 -*-

def plotSamples (samples, marker):
    """ 把一个二维的实例集合画在图板上,并就地标注每个点。
    :param samples: 二维实例列表
    :param marker: 用什么颜色、什么形状标记实例点。
    :return: 绘图输出。
    """
    xVals, yVals = [], []
    # 在每一个实例点位旁写了字,顺路搜集了实例点信息。
    for s in samples:
        x = s.getFeatures ()[0]
        y = s.getFeatures ()[1]
        pylab.annotate (s.getName (), xy = (x, y),
                       xytext = (x+0.13, y-0.07),
                       fontsize = 'x-large')
        xVals.append (x)
        yVals.append (y)
    # 画出这些实例点。
    pylab.plot (xVals, yVals, marker)
k-means 的收敛速度怎么样?几次迭代的结果之间差别大吗?
尝试 1 次,20 个点,经 5 次迭代后收敛。
Iteration #1
Cluster with centroid [4.53306878  5.90434189] contains:
 A1, A3, A4, A6, A7, B0, B2, B4, B5, B8
Cluster with centroid [5.07412874  4.67366431] contains:
 A0, A2, A5, A8, A9, B1, B3, B6, B7, B9

Iteration #2
Cluster with centroid [4.67292058  6.04914647] contains:
 A1, A3, A4, A6, B0, B2, B4, B5, B8
Cluster with centroid [4.91051726  4.66706762] contains:
 A0, A2, A5, A7, A8, A9, B1, B3, B6, B7, B9

Iteration #3
Cluster with centroid [5.02041425  6.16496333] contains:
 A1, A4, A6, B0, B2, B4, B5, B6, B8
Cluster with centroid [4.62620426  4.57230837] contains:
 A0, A2, A3, A5, A7, A8, A9, B1, B3, B7, B9

Iteration #4
Cluster with centroid [6.77702744  6.26557808] contains:
 B0, B3, B4, B5, B6, B7, B8, B9
Cluster with centroid [3.48797964  4.63795311] contains:
 A0, A1, A2, A3, A4, A5, A6, A7, A8, A9, B1, B2

Iteration #5
Cluster with centroid [6.77702744  6.26557808] contains:
 B0, B3, B4, B5, B6, B7, B8, B9
Cluster with centroid [3.48797964  4.63795311] contains:
 A0, A1, A2, A3, A4, A5, A6, A7, A8, A9, B1, B2

Final result
 Cluster with centroid [6.77702744  6.26557808] contains:
 B0, B3, B4, B5, B6, B7, B8, B9
 Cluster with centroid [3.48797964  4.63795311] contains:
 A0, A1, A2, A3, A4, A5, A6, A7, A8, A9, B1, B2
多次尝试的话,会改善收敛后的结果吗?
# -*- coding: utf-8 -*-
random.seed (0)
contrivedTest (1, 2, True)
Final result with dissimilarity 46.3275700363
Cluster with centroid [3.14170883 4.52143963] contains:
A0, A1, A2, A3, A4, A5, A6, A7, A8, A9
Cluster with centroid [5.93613865 5.96069975] contains:
B0, B1, B2, B3, B4, B5, B6, B7, B8, B9 # -*- coding: utf-8 -*-
random.seed (0)
contrivedTest (50, 2, False)Final result with dissimilarity 44.7251144328
Cluster with centroid [3.00314359 4.80337227] contains:
A0, A1, A2, A3, A4, A5, A6, A7, A9, B5
Cluster with centroid [6.07470389 5.67876712] contains:
A8, B0, B1, B2, B3, B4, B6, B7, B8, B9- 多次尝试,dissimilarity 当然有改善。
- A 与 B 来自两个不同的分布,还是会混在一起。not unreasonable
- 非监督机器学习只是从无标签的数据集中找到结构。
k 均值聚簇的相异度越低越好吗?
可以通过增大簇的个数来降低相异度。
但是过拟合真的有意义吗?
最好是知道先验信息,比如数据来自三个分布。
# -*- coding: utf-8 -*-
    random.seed (10)
    contrivedTest2 (40, 2)
    random.seed (10)
    contrivedTest2 (40, 3)
    random.seed (10)
    contrivedTest2 (40, 6)
Final result has dissimilarity 76.884
Cluster with centroid [5.87801162 4.59357585] contains:
A2, A7, B0, B1, B2, B3, B4, B5, B6, B7
Cluster with centroid [2.3748063 6.91043933] contains:
A0, A1, A3, A4, A5, A6, C0, C1, C2, C3, C4, C5, C6, C7
Final result has dissimilarity 30.41
Cluster with centroid [2.87396209 4.40703363] contains:
A0, A1, A2, A3, A4, A6, A7
Cluster with centroid [2.30211038 8.12587927] contains:
A5, C0, C1, C2, C3, C4, C5, C6, C7
Cluster with centroid [6.39883455 4.83747003] contains:
B0, B1, B2, B3, B4, B5, B6, B7
Final result has dissimilarity 14.869
Cluster with centroid [2.30660998 4.65494206] contains:
A0, A1, A3, A4
Cluster with centroid [1.60563482 7.3429928] contains:
C3, C6, C7
Cluster with centroid [5.90330335 4.62058076] contains:
B0, B1, B2, B5, B6, B7
Cluster with centroid [2.65034816 8.5173225] contains:
A5, C0, C1, C2, C4, C5
Cluster with centroid [3.63043156 4.07648907] contains:
A2, A6, A7
Cluster with centroid [7.88542817 5.48813782] contains:
B3, B423.4 A Less Contrived Example
如何读取源文件,并根据源文件结构构造数据结构?
# 名称
# 上切牙
# 上尖牙
# 前臼齿
# 前磨牙
# 下切牙
# 下犬牙
# 下前臼齿
# 下臼齿
# 重量
# 标签:0 = 草食动物  1 = 肉食动物   2 = 杂食动物
Badger 獾,3,1,3,1,3,1,3,2,10,1
Bear 熊,3,1,4,2,3,1,4,3,278,2
Beaver 河狸,1,0,2,3,1,0,1,3,20,0
Brown bat 棕蝠,2,1,1,3,3,1,2,3,0.5,1
Cat 猫,3,1,3,1,3,1,2,1,4,1
Cougar 美洲狮,3,1,3,1,3,1,2,1,63,1
Cow 牛,0,0,3,3,3,1,2,1,400,0
Deer 鹿,0,0,3,3,4,0,3,3,200,0
Dog 狗,3,1,4,2,3,1,4,3,20,1
Elk 麋鹿,0,1,3,3,3,1,3,3,500,0
Fox 狐狸,3,1,4,2,3,1,4,3,5,1
Fur seal 海狗,3,1,4,1,2,1,4,1,200,1
Grey seal 灰海豹,3,1,3,2,2,1,3,2,268,1
Guinea pig 豚鼠,1,0,1,3,1,0,1,3,1,0
Human 人,2,1,2,3,2,1,2,3,150,2
Jaguar 美洲虎,3,1,3,1,3,1,2,1,81,1
Kangaroo 袋鼠,3,1,2,4,1,0,2,4,55,0
Lion 狮子,3,1,3,1,3,1,2,1,175,1
Mink 水貂,3,1,3,1,3,1,3,2,1,1
Mole 鼹鼠,3,1,4,3,3,1,4,3,0.75,1
Moose 驼鹿,0,0,3,3,4,0,3,3,900,0
Mouse 小白鼠,1,0,0,3,1,0,0,3,0.3,2
Pig 猪,3,1,4,3,3,1,4,3,50,2
Porcupine 豪猪,1,0,1,3,1,0,1,3,3,0
Rabbit 兔子,2,0,3,3,1,0,2,3,1,0
Raccoon 浣熊,3,1,4,2,3,1,4,2,40,2
Rat 鼠,1,0,0,3,1,0,0,3,.75,2
Red bat 红蝠,1,1,2,3,3,1,2,3,1,1
Sea lion 海狮,3,1,4,1,2,1,4,1,415,1
Skunk 臭鼬,3,1,3,1,3,1,3,2,2,2
Squirrel 松鼠,1,0,2,3,1,0,1,3,2,2
Wolf 狼,3,1,4,2,3,1,4,3,27,1
Woodchuck 土拨鼠,1,0,2,3,1,0,1,3,4,2
# -*- coding: utf-8 -*-
def readMammalData (fName, scale):
"""
从源文件中读取哺乳动物信息,打包输出。
:str fName: 原始信息文件名
:param scale: 函数,归一化每一种特征向量
:return: 特征向量列表,标签列表,物种名称列表
"""
dataFile = open (fName, 'r')
numFeatures = 0
#处理文件开头的那些行
for line in dataFile: #找出特征数量
if line [0:3] == '# 标签 ': #表示特征行结束
break
if line [0:3] != '# 名称 ': #看原始数据,只要不是 "名称" 那一行,就对应着一种特征
numFeatures += 1
#生成 featureVals、speciesName 和 labelList
featureVals, speciesNames, labelList = [], [], []
# featureVals 是各种特征列表的列表,长度是特征的数量
for i in range (numFeatures):
featureVals.append ([])
#继续处理文件中的行,从注释后面开始
for line in dataFile:
#去掉换行符,然后对行进行拆分
dataLine = line [:-1].split (',')
#物种名,加入列表。
speciesNames.append (dataLine [0])
#已有分类标签,加入列表。
classLabel = dataLine [-1]
labelList.append (classLabel)
#为每一个物种,建立纵向的特征列表(注意不是某个物种的横向特征向量),加入特征列表。
for i in range (numFeatures):
featureVals [i].append (float (dataLine [i+1]))
#使用 featureVals 建立包含每个哺乳动物特征向量的列表
# 对于每个哺乳动物,按照设定的缩放方式对特征进行缩放
for i in range (numFeatures):
# 纵向的相同特征,统一刷一遍。
featureVals [i] = scale (featureVals [i])
featureVectorList = []
# 从纵向的相同特征列表的列表,构建出横向的特征向量的列表
for mammal in range (len (speciesNames)):
# 构建某个物种的特征向量
featureVector = []
for feature in range (numFeatures):
featureVector.append (featureVals [feature][mammal])
# 加入特征向量的列表
featureVectorList.append (featureVector)
return featureVectorList, labelList, speciesNames- featureVals 是由列表组成的列表,其中每个元素都是一个值列表,这个列表包含所有哺乳动物在某个特征上的取值。例如,所有哺乳动物体重的列表。表达式 featureVals [i][j] 的值就是第 j 种哺乳动物的第 i 个特征的值。
- readMammalData 的最后一部分使用 featureVals 中的值创建一个特征向量列表,其中的每个特征向量都对应一种哺乳动物
通常有哪两种归一化方式?
Z 分布,使得每个特征都均值为 0,标准差为 1。
# -*- coding: utf-8 -*-
def zScaleFeatures (vals):
    """
    将列表数据做标准正态分布(Z 分布)归一化处理
    :param vals: 浮点数列表 / 数组
    :return: z 分布归一化后的浮点数数组
    """
    result = pylab.array (vals)
    mean = sum (result)/len (result)
    result = result - mean
    return result/em_15_3_flip.stdDev (result)
将最小的特征值映射为 0,最大的特征值映射为 1,对中间的特征值使用线性插值。
# -*- coding: utf-8 -*-
def iScaleFeatures (vals):
    """
    将列表数据线性映射到 [0, 1] 区间做归一化处理
    :param vals: 浮点数列表 / 数组
    :return: [0,1] 区间内的浮点数数组
    """
    minVal, maxVal = min (vals), max (vals)
    # 用头尾两个点,找一阶线性回归模型
    fit = pylab.polyfit ([minVal, maxVal], [0, 1], 1)
    # 返回输入数组对应的模型上的输出数据
    return pylab.polyval (fit, vals)
有了缩放的食性区分结果怎样?
# -*- coding: utf-8 -*-
def testTeeth (numClusters, numTrials, scale = lambda x: x):
    """
    读数据,做运算
    :param numClusters: 分成几个簇
    :param numTrials: k-means 相似聚簇做几次尝试
    :param scale: 缩放函数,默认 identity function 不做处理
    :return: 打印结果
    """
    # 提取信息
    features, labels, species =\
              readMammalData ('dentalFormulas.txt', scale)
    # 创建实例
    examples = buildMammalExamples (features, labels, species)
    # k-means 相似聚簇
    bestClustering = em_23_2_k_means_clustering.trykmeans (examples, numClusters, numTrials)
    # 打印输出结果
    for c in bestClustering:
        # 为每一个簇打印内部对象
        names = ''
        for p in c.members ():
            names += p.getName () + ', '
        print ('\n' + names [:-2]) #除去末尾的逗号和空格
        # 检验同一个簇中的实例是否真的是同类
        herbivores, carnivores, omnivores = 0, 0, 0
        for p in c.members ():
            if p.getLabel () == '0':
                herbivores += 1
            elif p.getLabel () == '1':
                carnivores += 1
            else:
                omnivores += 1
        print (herbivores, 'herbivores,', carnivores, 'carnivores,',
          omnivores, 'omnivores')


def main ():
    random.seed (0)
    print ('Clustering without scaling')
    testTeeth (3, 40)
    random.seed (0)
    print ('\nClustering with z-scaling')
    testTeeth (3, 40, zScaleFeatures)
    random.seed (0)
    print ('\nClustering with i-scaling')
    testTeeth (3, 40, iScaleFeatures)
Clustering without scaling
Moose 驼鹿
1 herbivores, 0 carnivores, 0 omnivores
Bear 熊,Cow 牛,Deer 鹿,Elk 麋鹿,Fur seal 海狗,Grey seal 灰海豹,Lion 狮子,Sea lion 海狮
3 herbivores, 4 carnivores, 1 omnivores
Badger 獾,Beaver 河狸,Brown bat 棕蝠,Cat 猫,Cougar 美洲狮,Dog 狗,Fox 狐狸,Guinea pig 豚鼠,Human 人,Jaguar 美洲虎,Kangaroo 袋鼠,Mink 水貂,Mole 鼹鼠,Mouse 小白鼠,Pig 猪,Porcupine 豪猪,Rabbit 兔子,Raccoon 浣熊,Rat 鼠,Red bat 红蝠,Skunk 臭鼬,Squirrel 松鼠,Wolf 狼,Woodchuck 土拨鼠
5 herbivores, 11 carnivores, 8 omnivores
Clustering with z-scaling
Badger 獾,Bear 熊,Brown bat 棕蝠,Cat 猫,Cougar 美洲狮,Dog 狗,Fox 狐狸,Fur seal 海狗,Grey seal 灰海豹,Human 人,Jaguar 美洲虎,Lion 狮子,Mink 水貂,Mole 鼹鼠,Pig 猪,Raccoon 浣熊,Red bat 红蝠,Sea lion 海狮,Skunk 臭鼬,Wolf 狼
0 herbivores, 15 carnivores, 5 omnivores
Beaver 河狸,Guinea pig 豚鼠,Kangaroo 袋鼠,Mouse 小白鼠,Porcupine 豪猪,Rabbit 兔子,Rat 鼠,Squirrel 松鼠,Woodchuck 土拨鼠
5 herbivores, 0 carnivores, 4 omnivores
Cow 牛,Deer 鹿,Elk 麋鹿,Moose 驼鹿
4 herbivores, 0 carnivores, 0 omnivores
Clustering with i-scaling
Badger 獾,Bear 熊,Brown bat 棕蝠,Cat 猫,Cougar 美洲狮,Dog 狗,Fox 狐狸,Fur seal 海狗,Grey seal 灰海豹,Human 人,Jaguar 美洲虎,Lion 狮子,Mink 水貂,Mole 鼹鼠,Pig 猪,Raccoon 浣熊,Red bat 红蝠,Sea lion 海狮,Skunk 臭鼬,Wolf 狼
0 herbivores, 15 carnivores, 5 omnivores
Beaver 河狸,Guinea pig 豚鼠,Kangaroo 袋鼠,Mouse 小白鼠,Porcupine 豪猪,Rabbit 兔子,Rat 鼠,Squirrel 松鼠,Woodchuck 土拨鼠
5 herbivores, 0 carnivores, 4 omnivores
Cow 牛,Deer 鹿,Elk 麋鹿,Moose 驼鹿
4 herbivores, 0 carnivores, 0 omnivores- 对特征进行缩放后的聚类得到了相同的簇,结果都没有基于饮食习惯对动物进行完美区分,
- 它成功区分了肉食动物和草食动物,对于杂食动物没有找到明显的模式。
- 这说明除了齿系和体重之外,还可能需要其他特征才能将杂食动物与其他两种动物区分开来。
以上,2018-05-22 16:05:45