贝贝60秒:果然一图胜千言
曲政 / 2019-09-05
今天是贝贝报告给你的第 189 天
2019-09-05 星期四
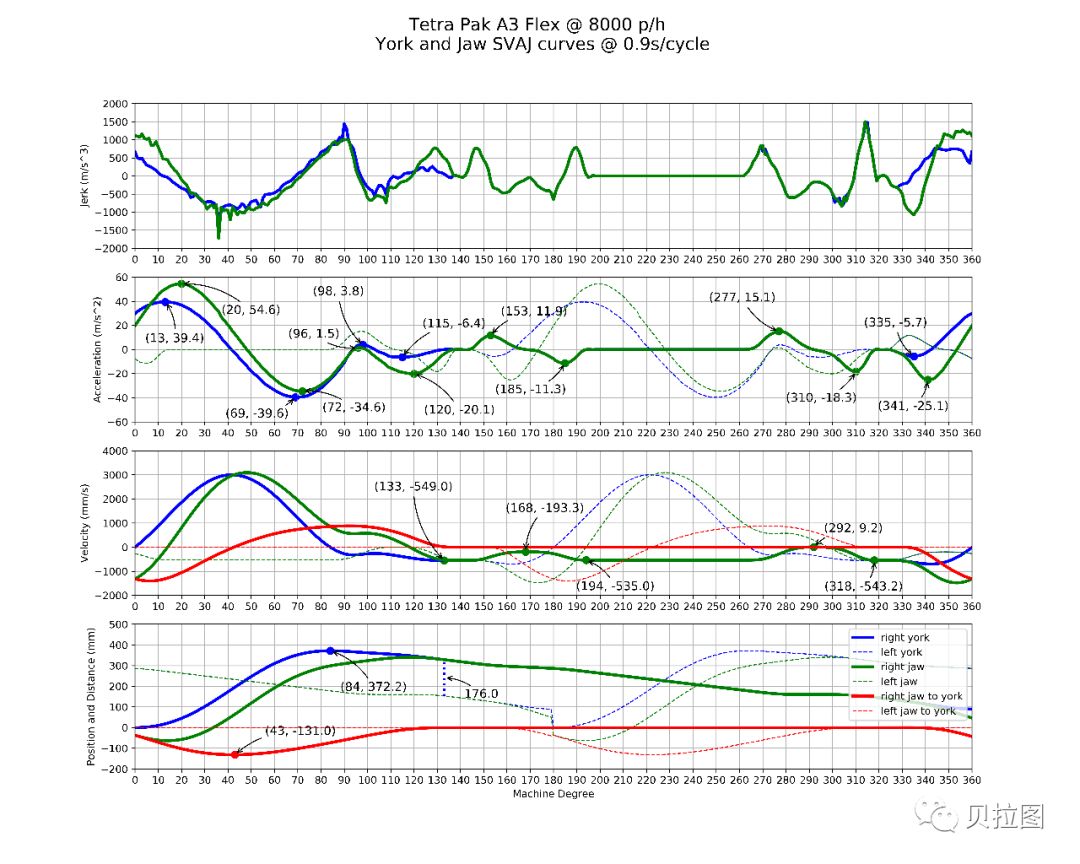
今天重新生成了一张图,读出了更多信息。我明白了计算机工程师为什么喜欢讲:“Talk is cheap, show me the code.”
我们机械工程师喜欢看图,也许可以说:“拿开这些数据,给我看图。”
我今天也不多讲了,就呈现那张图,还有生成图的命令,以及读取的原始数据。
 import csv
 from collections import namedtuple
 import numpy as np
 from scipy.integrate import cumtrapz

 def get_csv_data():
     """
     Get 360 degree york and jaw acceleration data from csv file.
     :return: lists of float of data
     """
     with open('../data/RawData_360.csv') as f:
         f_csv = csv.reader(f)
         headings = next(f_csv)
         Row = namedtuple('Row', headings)
         degree, york_acc, jaw_acc = [], [], []
         for r in f_csv:
             row = Row(*r)
             degree.append(int(row.Degree))
             york_acc.append(float(row.York_acc))
             jaw_acc.append(float(row.Jaw_acc))
     return np.array(degree), np.array(york_acc), np.array(jaw_acc)

 def meet_jork_jaw_there(york_acc, jaw_acc):
     for i in range(130, 340):
         if abs(york_acc[i] - jaw_acc[i]) < 0.3:
             york_acc[i] = jaw_acc[i] = (york_acc[i] + jaw_acc[i])/2
     return york_acc, jaw_acc


 def zerolyse_part_of_acc(york_acc, jaw_acc):
     """In the center part, they should be exact zeros.

     :param york_acc:
     :param jaw_acc:
     :return: side effect
     """
     for i in range(198, 263):
         if abs(york_acc[i]) < 0.3:
             york_acc[i] = jaw_acc[i] = 0
     return york_acc, jaw_acc


 def calculate_avp():
     """Calculate the acceleration, velocity and placement from csv data.
     :return """
     degree, york_acc, jaw_acc = get_csv_data()
     york_acc -= 0.169
     jaw_acc -= 0.159
     york_acc, jaw_acc = meet_jork_jaw_there(york_acc, jaw_acc)
     york_acc, jaw_acc = zerolyse_part_of_acc(york_acc,jaw_acc)
     york_velo = cumtrapz(york_acc, degree, initial=0) * (0.9 / 360 * 1000)
     jaw_velo = cumtrapz(jaw_acc, degree, initial=0) * (0.9 / 360 * 1000)
     jaw_velo = jaw_velo - (jaw_velo[220] - york_velo[220])
     york_place = cumtrapz(york_velo, degree, initial=0) * (0.9 / 360)
     jaw_place = cumtrapz(jaw_velo, degree, initial=0) * (0.9 / 360)
     jaw_place += york_place[230]-jaw_place[230]
     return degree, york_acc, jaw_acc, york_velo, jaw_velo, york_place, jaw_place

 if __name__ == "__main__":
     degree, york_acc, jaw_acc, york_velo, jaw_velo, york_place, jaw_place = calculate_avp()
     print('the last three of york_velocity:', york_velo[-3], york_velo[-2], york_velo[-1])
     # print('the last two of jaw_velocity:', jaw_velo[-2], jaw_velo[-1])
     print('the first three of york_velocity:', york_velo[0], york_velo[1], york_velo[2])
     print(york_velo[-3] - york_velo[-2])
     print(york_velo[1] - york_velo[2])
     print(york_velo[-2] - york_velo[1])

     print('the last three of jaw_velocity:', jaw_velo[-3], jaw_velo[-2], jaw_velo[-1])
     # print('the last two of jaw_velocity:', jaw_velo[-2], jaw_velo[-1])
     print('the first three of jaw_velocity:', jaw_velo[0], jaw_velo[1], jaw_velo[2])
     print(jaw_velo[-3] - jaw_velo[-2])
     print(jaw_velo[1] - jaw_velo[2])
     print(jaw_velo[-2] - jaw_velo[1])
     print("-"*10)
     print(york_place[133]-york_place[133+180])


 # def bisection_search(start ,end):
 # TODO: fine tune the adjust value
 #

 from read_raw_data import calculate_avp
 import matplotlib.pyplot as plt
 import numpy as np

 # Get data from raw csv data as right york and jaw pair.
 d, \
 right_york_acc, right_jaw_acc, \
 right_york_velo, right_jaw_velo, \
 right_york_place, right_jaw_place \
     = calculate_avp()

 right_york_jerk = np.ones(361)
 right_york_jerk[:360] = np.diff(right_york_acc)
 right_york_jerk[-1] = right_york_jerk[0]  # fill the end point as the same of start
 right_york_jerk = right_york_jerk / (0.9 / 360)
 right_jaw_jerk= np.ones(361)
 right_jaw_jerk[:360] = np.diff(right_jaw_acc)
 right_jaw_jerk[-1] = right_jaw_jerk[0]  # fill end point
 right_jaw_jerk = right_jaw_jerk / (0.9 / 360)

 # Slicing data for the left york and jaw pair.
 left_york_acc = np.hstack((right_york_acc[-181:-1], right_york_acc[:181]))
 left_jaw_acc = np.hstack((right_jaw_acc[-181:-1], right_jaw_acc[:181]))
 left_york_velo = np.hstack((right_york_velo[-181:-1], right_york_velo[:181]))
 left_jaw_velo = np.hstack((right_jaw_velo[-181:-1], right_jaw_velo[:181]))
 left_york_place = np.hstack((right_york_place[-181:-1], right_york_place[:181]))
 left_jaw_place = np.hstack((right_jaw_place[-181:-1], right_jaw_place[:181]))

 # Calculate the relative velocities and placements between york and jaw.
 right_jaw_to_york_velo = right_jaw_velo - right_york_velo
 right_jaw_to_york_place = right_jaw_place - right_york_place
 left_jaw_to_york_velo = left_jaw_velo - left_york_velo
 left_jaw_to_york_place = left_jaw_place - left_york_place


 def annotate_max_min_part_curve(a, start=0, end=None, col='red', mark_size=50, position=(50, 50), font_size=12):
     """Mark a scatter on the curve of an array at index with position coordinate.

     :param a: array-like object
     :param start, end: int indicating the place of certain item in the array
     :param col: string of scatter color, better being the same with the curve of array
     :param mark_size: int (of points?)
     :param position: tuple of two ints or floats, relative to the scatter's place
     :param font_size: int of the messages' size
     :return: None, effecting the plt object
     """
     if a[start] <= a[start + 1] and a[end - 1] >= a[end]:
         f = np.argmax
     elif a[start] >= a[start + 1] and a[end - 1] <= a[end]:
         f = np.argmin
     else:
         raise IndexError
     index = f(a[start:end]) + start
     plt.scatter([index, ], [a[index], ], mark_size, color=col)
     plt.annotate("(" + str(index) + ', '+ str(round(a[index], 1)) + ")",
                  xy=(index, a[index]), xycoords='data',
                  xytext=position, textcoords='offset points', fontsize=font_size,
                  arrowprops=dict(arrowstyle="->", connectionstyle="arc3,rad=.2"))


 # Create a figure of size 8x6 inches, 80 dots per inch
 fig = plt.figure(figsize=(15, 12), dpi=80)
 fig.suptitle('Tetra Pak A3 Flex @ 8000 p/h \n York and Jaw SVAJ curves @ 0.9s/cycle', fontsize='xx-large')

 # Jerk
 plt.subplot(4, 1, 1)
 plt.grid()
 plt.ylabel("Jerk (m/s^3)")
 plt.plot(d, right_york_jerk, color="blue", linewidth=3.0, linestyle="-", label="right york")
 plt.plot(d, right_jaw_jerk, color="green", linewidth=3.0, linestyle="-", label="right jaw")
 # plt.legend(loc='upper right')
 plt.xlim(0.0, 360.0)
 plt.xticks(np.linspace(0, 360, 37, endpoint=True))
 plt.ylim(-2000.0, 2000.0)
 plt.yticks(np.linspace(-2000, 2000, 9, endpoint=True))

 # Acceleration
 plt.subplot(4, 1, 2)
 plt.grid()
 plt.ylabel("Acceleration (m/s^2)")
 plt.plot(d, right_york_acc, color="blue", linewidth=3.0, linestyle="-", label="right york")
 plt.plot(d, left_york_acc, color="blue", linewidth=1.0, linestyle="--", label="left york")
 # Plot jaw acceleration with a green continuous line of width 1 (pixels)
 plt.plot(d, right_jaw_acc, color="green", linewidth=3.0, linestyle="-", label="right jaw")
 plt.plot(d, left_jaw_acc, color="green", linewidth=1.0, linestyle="--", label="left jaw")
 annotate_max_min_part_curve(right_york_acc, 0, 20, col="blue", position=(-20,-40))
 annotate_max_min_part_curve(right_jaw_acc, 10, 30, col="green", position=(40,-30))
 annotate_max_min_part_curve(right_york_acc, 60, 80, col="blue", position=(-70,-20))
 annotate_max_min_part_curve(right_jaw_acc, 60, 80, col="green", position=(20,-20))
 annotate_max_min_part_curve(right_york_acc, 90, 100, col="blue", position=(-50,50))
 annotate_max_min_part_curve(right_jaw_acc, 90, 100, col="green", position=(-70,10))
 annotate_max_min_part_curve(right_york_acc, 110, 130, col="blue", position=(20,30))
 annotate_max_min_part_curve(right_jaw_acc, 110, 130, col="green", position=(10,-40))
 annotate_max_min_part_curve(right_jaw_acc, 150, 160, col="green", position=(10,20))
 annotate_max_min_part_curve(right_jaw_acc, 180, 190, col="green", position=(-70,-30))
 annotate_max_min_part_curve(right_jaw_acc, 270, 280, col="green", position=(-70,30))
 annotate_max_min_part_curve(right_jaw_acc, 300, 315, col="green", position=(-70,-30))
 annotate_max_min_part_curve(right_york_acc, 330, 340, col="blue", position=(-50,30))
 annotate_max_min_part_curve(right_jaw_acc, 330, 350, col="green", position=(-50,-30))
 # plt.legend(loc='upper right')
 plt.xlim(0.0, 360.0)
 plt.xticks(np.linspace(0, 360, 37, endpoint=True))
 plt.ylim(-60.0, 60.0)
 plt.yticks(np.linspace(-60, 60, 7, endpoint=True))

 # Velocity
 plt.subplot(4, 1, 3)
 plt.grid()
 plt.ylabel("Velocity (mm/s)")
 plt.plot(d, right_york_velo, color="blue", linewidth=3.0, linestyle="-", label="right york")
 plt.plot(d, left_york_velo, color="blue", linewidth=1.0, linestyle="--", label="left york")
 plt.plot(d, right_jaw_velo, color="green", linewidth=3.0, linestyle="-", label="right jaw")
 plt.plot(d, left_jaw_velo, color="green", linewidth=1.0, linestyle="--", label="left jaw")
 plt.plot(d, right_jaw_to_york_velo, color="red", linewidth=3.0, linestyle="-", label="right jaw to york")
 plt.plot(d, left_jaw_to_york_velo, color="red", linewidth=1.0, linestyle="--", label="left jaw to york")

 annotate_max_min_part_curve(right_york_velo, 130, 150, col="green", position=(-70,70))
 annotate_max_min_part_curve(right_york_velo, 160, 180, col="green", position=(-20,40))
 annotate_max_min_part_curve(right_york_velo, 180, 280, col="green", position=(-10,-30))
 annotate_max_min_part_curve(right_york_velo, 280, 310, col="green", position=(10,15))
 annotate_max_min_part_curve(right_york_velo, 310, 320, col="green", position=(-50,-30))

 # plt.legend(loc='upper right')
 plt.xlim(0.0, 360.0)
 plt.xticks(np.linspace(0, 360, 37, endpoint=True))
 plt.ylim(-2000, 4000)
 plt.yticks(np.linspace(-2000, 4000, 7, endpoint=True))

 plt.subplot(4, 1, 4)
 plt.grid()
 plt.xlabel("Machine Degree")
 plt.ylabel("Position and Distance (mm)")
 plt.plot(d, right_york_place, color="blue", linewidth=3.0, linestyle="-", label="right york")
 plt.plot(d, left_york_place, color="blue", linewidth=1.0, linestyle="--", label="left york")
 plt.plot(d, right_jaw_place, color="green", linewidth=3.0, linestyle="-", label="right jaw")
 plt.plot(d, left_jaw_place, color="green", linewidth=1.0, linestyle="--", label="left jaw")
 plt.plot(d, right_jaw_to_york_place, color="red", linewidth=3.0, linestyle="-", label="right jaw to york")
 plt.plot(d, left_jaw_to_york_place, color="red", linewidth=1.0, linestyle="--", label="left jaw to york")
 index_min_diff_right_york_place_right_jaw_place = np.argmin(right_jaw_to_york_place)
 index_max_right_york_place = np.argmax(right_york_place)
 annotate_max_min_part_curve(right_jaw_to_york_place, 20, 80, col="red", position=(30,20))
 annotate_max_min_part_curve(right_york_place, 40, 100, col="blue", position=(10,-40))
 plt.plot([133, 133], [left_york_place[133], right_york_place[133]], color='blue', linewidth=2, linestyle=":")
 plt.annotate(str(round(right_york_place[133] - left_york_place[133])),
                  xy=(133, (right_york_place[133] + left_york_place[133])/2), xycoords='data',
                  xytext=(20, -20), textcoords='offset points', fontsize=12,
                  arrowprops=dict(arrowstyle="->", connectionstyle="arc3,rad=.2"))
 plt.legend(loc='upper right')
 plt.xlim(0.0, 360.0)
 plt.xticks(np.linspace(0, 360, 37, endpoint=True))
 plt.ylim(-200, 500)
 plt.yticks(np.linspace(-200, 500, 8, endpoint=True))

 # Save figure using 720 dots per inch
 plt.savefig("Tetra Pak A3 flex Curves.png", dpi=720)

 # Show result on screen
 # plt.show()